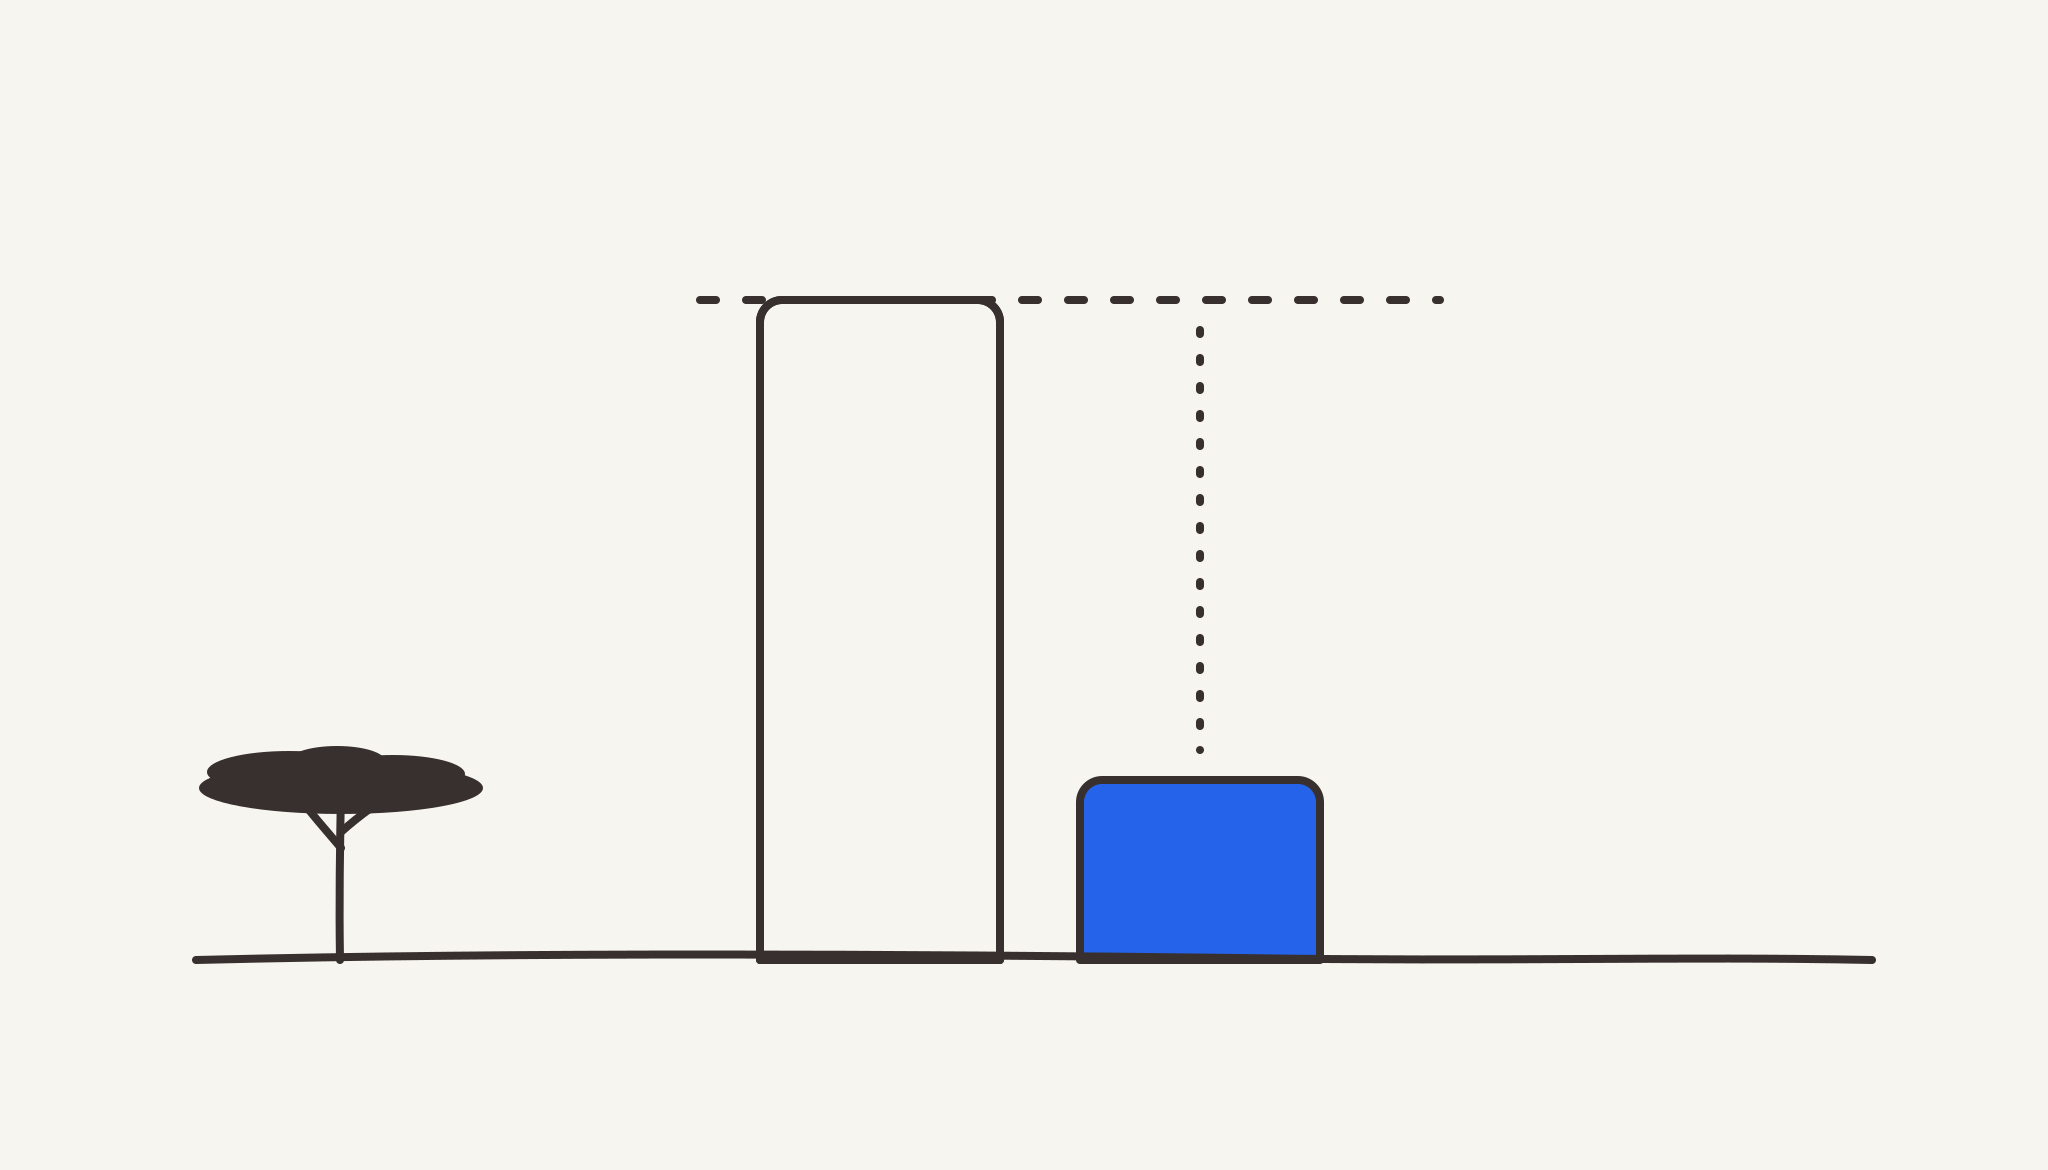
Adoption Is Not Automation
Your AI dashboard reports who logged in. It cannot tell you whether any work changed hands, and those are not the same question.
The core argument here is not ours. Varick Agents made it first, in a piece called AI Adoption is a Myth, and the observation that adoption splits into a barbell rather than a curve belongs to them. What follows applies that argument to African enterprise, where the constraint turns out to be different from the one most of the writing on this assumes.
The number that is not measuring anything
Six months after a rollout, the report to the board usually looks something like this: activation seventy eight percent, monthly active users sixty five percent, a few prompts per user per day. Directionally up. Everyone nods.
Now ask a different question. What percentage of the work is being done differently than it was before?
In most organisations nobody can answer, because nobody is measuring it. And in most organisations, if you went and looked, the honest answer would be close to none.
Both of those things can be true simultaneously. High adoption, unchanged business. They are not in tension, because adoption measures whether someone opened the software. It says nothing about whether any work changed hands.
The shape adoption actually takes
The instinct is to imagine usage as a bell curve. A few enthusiasts, a large competent middle, a few holdouts. Train the middle, move the average, done.
That is not the shape. The shape is a barbell.
| Group | Roughly | What they do | Share of the value |
|---|---|---|---|
| Builders | 5 to 10% | Daily use, connect systems, automate a workflow end to end, produce things that run without them | Most of it |
| Shallow users | 15 to 20% | Real daily use. Reformatting, summarising, general questions. No workflow changes | A little |
| Non users | 70 to 80% | Opened it once, or never | None |
The middle everyone is trying to train is not sitting between the two ends. It is much closer to the bottom than the top, and it does not drift upward on its own.
You can run excellent training, appoint champions in every department, tie it to objectives, and still get a barbell. This is not a rollout failure. It is what happens when a general purpose tool meets a population with very different appetites for redesigning their own work.
What that looks like with numbers attached
Three illustrative profiles. These are models, built to show the shape at different scales, not descriptions of any organisation.
A large institution, 2,000 licences. Around 200 people build things: finance automating reconciliation, relationship teams running structured customer reviews. Around 400 use it daily and shallowly. Around 1,400 do not use it. The dashboard reports high adoption because it counts anyone who logged in once. The spend is substantial. The business runs at the speed it ran at before.
A mid sized firm, 120 licences. Around 15 people build things, and one engineer’s agent genuinely does the work of several people. Around 25 use it shallowly, some of them pasting customer data into consumer tools without redaction. Around 80 do not use it. The builders are dramatically faster. Overall velocity moves by a rounding error.
A small organisation, 50 licences, no formal training. Around 5 people build things, including a finance lead who reconciles against Sage and drafts board papers with it. Around 10 use it shallowly. Around 35 do not. The five are faster. The organisation is not.
The pattern holds at every scale, with or without training budget. That is the uncomfortable part.
Why the usual metrics mislead
Most adoption reporting collapses a wide spectrum into a yes or no.
Consider three people. The first logged in once, asked something trivial, and never returned. The second logs in daily to reformat emails. The third built three agents that run reconciliation, validation and onboarding against live systems.
All three are counted identically. That is not a small measurement flaw, it is the whole problem: the metric is structurally incapable of distinguishing the person generating all the value from the person generating none.
Measure these instead
| Measure | Why it matters |
|---|---|
| Share of work automated | The only figure that connects to business impact. Audit your top workflows and classify each as manual, hybrid, or automated |
| Agents in production | Things running against live data, not experiments in someone’s browser |
| Time per workflow, before and after | Requires timing the manual baseline first, which almost nobody does |
| Movement between groups | Are shallow users becoming builders? If not, training is not working, whatever the attendance says |
Reporting “twelve percent of this workflow is now fully automated, up from zero, with twenty three percent hybrid” tells a board something. Reporting seventy eight percent adoption tells them nothing they can act on.
The gap is widening, not closing
Every AI product roadmap points the same way: more capable agents, more connectors, more autonomy. All genuinely useful, and all of it raises the floor of skill required to get the benefit.
Basic question and answer needs nothing. Anyone can do it, which is why the shallow group exists at all. Designing a workflow that runs unattended, deciding what should be automated and what must stay human, connecting a system and reasoning about what happens when it returns something unexpected, these are not prompting skills. They are analysis and systems design, and each product generation asks for more of them, not less.
So the builders keep pulling away, and the median employee stays at reformatting. The gap does not close as the technology improves. It widens.
The incentive nobody mentions
Here is the part that makes this harder than a training problem.
Your builders have no particular reason to close the gap.
They are visibly more productive than their peers. They are the person others come to. If everyone in the department could do what they do, that standing disappears.
Ask honestly why a relationship manager who built something that saves forty minutes per customer review would hand it to the other twelve relationship managers. If they all use it, the edge is gone. If she is the only one, she is the top performer.
That is not bad faith. It is a rational response to how the organisation measures and rewards people. And it means “the builders will naturally spread it” is not a plan.
Two paths, sized to reality
Stop trying to move everyone into the top group. Run two tracks instead.
For the builders, roughly a tenth of the organisation
Train them properly. Not prompt workshops. Workflow design, what makes a process a good automation candidate, how to reason about failure, how to work with an API.
Give them somewhere to publish. A shared internal place where a working agent or workflow can be found and reused by another team, rather than living on one laptop.
Make sharing count. If recognition and review only reward personal output, the incentive above stays exactly as it is. Reward work that other teams adopted.
Measure their output in production, not prompts. One finance lead’s reconciliation agent, adopted by twelve other teams, is the entire return on this track.
Some people will never install anything, even at one click. That is fine. You are not trying to reach them here.
For everyone else, the other nine tenths
Put the AI behind the systems they already use, rather than in front of them as a blank box. Nobody in accounts payable wants to write a prompt. They want the invoice to arrive already matched.
Automate the routine and route the exceptions. Take a repetitive workflow, invoice processing, onboarding, document validation, and have it run on a schedule. People see only what needs a decision.
Design for approvers, not prompters. The interface should say here is what happened, approve, reject or amend. Not, what would you like to do today.
Measure the automated share, not the login count.
Take accounts payable. Before: twenty analysts moving invoices from email into the ledger and around an approval chain by hand, with an error rate in the high single digits. After: capture, purchase order matching and entry run automatically, most invoices complete untouched, the remainder route to a person for review, and error rates fall because the repetitive step where mistakes were being made is no longer being done by a tired human at four in the afternoon.
None of those analysts became AI experts. Their tool got better. That is the entire point of this track.
Why this is harder in Kenya, and more valuable
Everything above applies anywhere. Three things make the African version different.
The systems that matter have no connectors. M-Pesa Daraja, KRA GavaConnect, CRB, SACCO core banking. Copilot, Claude and ChatGPT have connectors for none of them. So even a determined builder cannot automate anything that touches the data the business actually runs on, unless someone commissions a custom integration. That is a project with a budget and a timeline, which means it does not happen, which means the builders here are working with one hand tied.
This is the crucial difference. In most markets the constraint on the builder track is skill. Here the constraint is access. You can have the most capable people in Nairobi and they still cannot build the thing that matters.
Compliance blocks the useful use cases. The Data Protection Act is real and being enforced. Consumer AI tools provide no audit trail, no access control, and no answer when someone asks who accessed customer data last Tuesday. So the reconciliation nobody can safely do in ChatGPT is precisely the reconciliation worth automating.
The skills base is thin and stretched. Most organisations here do not have people sitting around who have already built agents. IT is occupied keeping existing systems running. Which is an argument for the two track approach rather than against it: do not require the whole organisation to become expert. Let the small group who want to go deep actually be able to, and build the results into everyone else’s existing tools.
What to do on Monday
If you are the chief executive, stop asking for the adoption number. Ask which three workflows changed, and by how much. If nobody can name three, the programme has not started yet regardless of what has been spent.
If you are the CIO, audit your top ten workflows and classify each as manual, hybrid or automated. Report that to the board instead of activation rates. It is a harder number to produce and the only one worth presenting.
If you are the CFO, find out what proportion of licences are doing nothing, then ask a second question: are the people who would use it well being blocked by access rather than ability? Cancelling licences fixes the first problem. Only connecting systems fixes the second, and the second is where the return is.
The bottom line
Adoption is not automation, and the dashboard cannot tell the difference.
A tenth of your organisation will drive nearly all the value. Most of the rest will never prompt anything, and that is not a failure to be corrected. Train the few properly, give them somewhere to publish, and build their results into the tools everyone else already uses.
Then measure what share of the work actually changed hands. It is the only number that survives contact with a board that asks a follow up question.
Msharti is the AI access layer for African enterprise, connecting AI assistants to M-Pesa, KRA, Sage, core banking and Microsoft 365 through one governed endpoint with role based access and query level audit. Built in Nairobi. Talk to us.

See it running against your own systems.
Book a 20-minute demo. We'll connect one of your systems live.
Talk to Us